Writing Task One – 25/4/2019
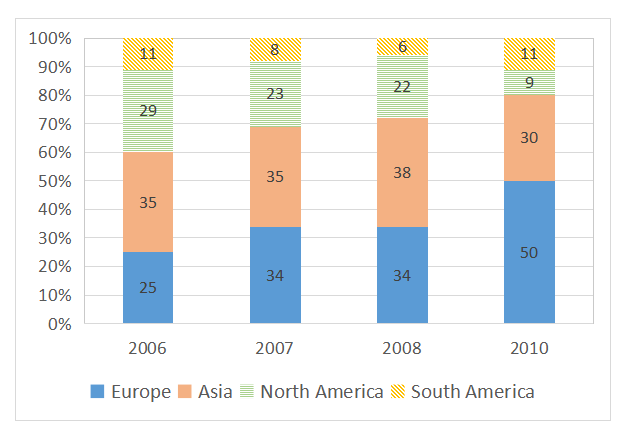
The bar chart shows the percentage of car manufactures’ total car sales in different regions from 2006 to 2010. The bar chart reveals the changes in the proportion of cars sold by car producers in four different parts of the world between 2006 and 2010. Overall, European and Asian car manufactures sold far more automobiles than the other two regions. In addition, Europe was the only area where the percentage of total car sales increased, almost doubling over this time…